Our Wilder Kent Awards journey: Invicta Sun Club
Blog
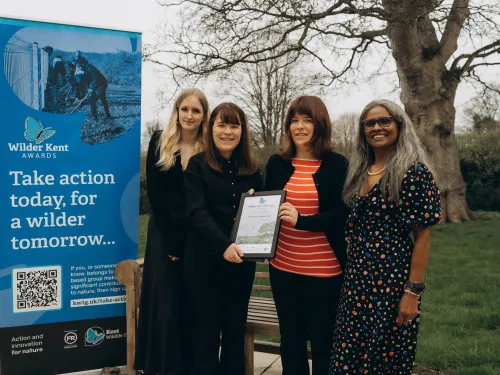
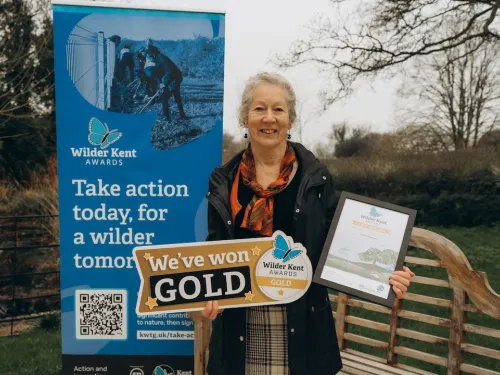
Invicta Sun Club was awarded Gold in the Community Group category at the Kent Wilder Awards, recognising years of dedicated ecological and environmental work.